The long and winding returns

I have previously shared articles by Carl Richards, author of The Behavior Gap. We always have copies available if you would like to give it a read.

Recently, Carl released an article called Market forecasting isn’t like the weather.

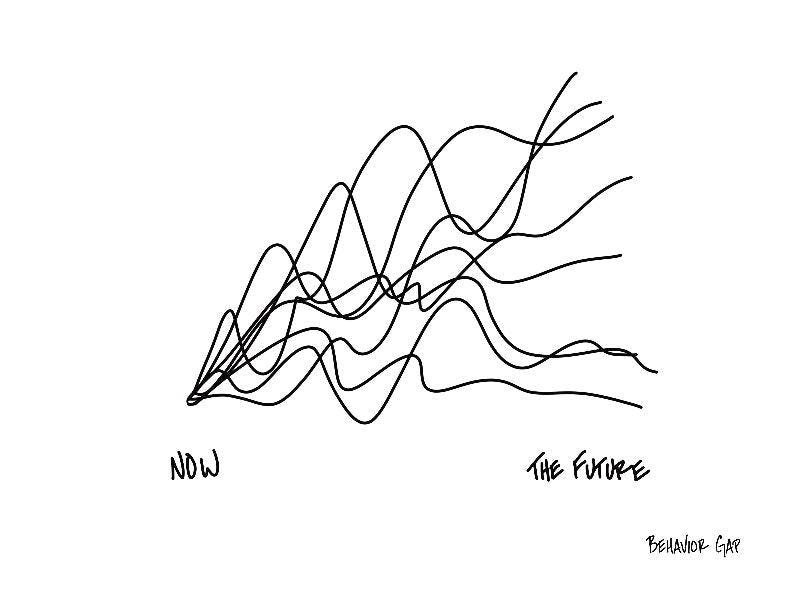
Carl is famous for his napkin sketches. Each sketch illustrates a simple idea about investing. Here is the image from that article. You can't get a more simplified explanation of what markets deliver for investors.

Carl uses this sketch to describe how difficult it is to guess where the market is going. The chart instead reminded me of this article I wrote way back in 2019. To sum up, even a long period with average returns may include big ups and big downs. While we would prefer to have our portfolios grow in a straight line, market declines are nearly as common as rises.

We have just been through many years just like this, with COVID, Ukraine, Evergrande, and now inflation and interest rate rises. However, economies also boomed as we left the worst of the pandemic behind us.

When making projections, we often use only the expected return to estimate how our portfolios will grow. Over four years ending December 2022, globally diversified shares delivered a healthy return of 9.4% p.a. Here is what that looks like using the performance of the Dimensional Global Core Equity Trust NZD Hedged.

In reality, these four years included a 26% drop in 2020 and a 21% drop in 2022. Although the overall return was about average for shares, the road was very bumpy. Here is the outcome we actually experienced.

With hindsight, we understand the importance of staying patient during times like this. Living through it is another story. It was scary watching how share prices plummeted during early 2020. Nobody would have guessed prices would be out of the red by the end of the year.

It is also important to note that markets always behave like this. While we can make our best predictions using statistical models, they only represent an average of all outcomes. An actual "average" period for shares looks like that blue line above.

The takeaway here is that models are useful for long-term planning, but actual markets bunny-hop along like stalling engines. Don't be dissuaded by backwards steps along the way. A long-term view puts these bumps in perspective.

Strategy Deep Dive - Factors and Dimensions

With these articles, I usually stick to the larger picture. There are many big ideas investors should know about. These usually allow for analogies and interesting stories/examples. Today I wanted to dive into something a bit more technical.

Recently, several members of Dimensional's research team published a paper titled Reversals and the Returns to Liquidity Provision. That link will bring you to the paper itself, while here leads to a short discussion regarding the paper's main findings.

In short, stocks that have very recently soared tend to do worse in the short-term and vice versa. The paper shows the link between a company's liquidity and the size/speed of the reversal.

This is an interesting effect, which runs counter to what we know about momentum. Over less than a month, a stock which has done exceptionally well will tend to do worse in the coming weeks. This is a reversal. However, stocks that have done well for a quarter or so tend to do well for the next few quarters. This is momentum.

The reason for the seemingly contrary results lies in the underlying causes. Momentum is easy to understand. A rising share price following new information tends to last for some time. Reversals, on the other hand, are symptomatic of how markets operate to provide liquidity.

Often when we trade individual stocks, we aren't buying and selling directly to other individual investors. "Market makers" sit in the middle, buying large amounts of shares and selling them later to other investors. This keeps markets moving so investors don't have to wait long periods or face big discounts when unloading shares.

Market makers don't do this for free. Like how banks must charge more interest on loans than they pay on deposits, market makers pay slightly less than the market rate when buying and receive slightly more when selling. This is how they are compensated for keeping things running.

Understanding this explains why a stock's price would reverse after a big move. A large bundle of purchases require market makers to step in and they ask slightly more than the market price. The market price later drops when they offload shares to investors.

The paper above showed how the liquidity of a company affects this trend. The less a share is traded, the higher the amount market makers "charge" for providing liquidity. This leads to a bigger change in prices and a more rapid change.

Sure, this is somewhat interesting, but what does it actually mean for us?

Dimensional's overall strategy revolves around diversifying across the whole market, while carefully tilting towards, small, value and profitable companies. By focusing on long-term drivers of returns, they can minimise the costs of trading.

These factors, momentum and reversals, are very short term. While a value companies take about 7 years on average to deliver their expected surplus returns, a reversal happens over a month. Momentum happens over 9 months. Making a strategy based around these factors means buying big lots of shares only to get rid of them months later. Sounds expensive!

But when we have portfolios containing 8,000 different companies, these findings are not going to waste. While they are not adopted at the top level of the strategy, they are useful at the trading stage.

Every day, Dimensional is studying the prices of all holdings in their funds. For example, when a company grows from a small company into a large company, it's expected return drops. This triggers a sell flag for the portfolio managers. All of these flags are sent to the trading team, who may have a list of a dozen different companies.

At this stage, the trading team will evaluate which of these companies to buy/sell. Here is where these other factors come in. If the share price has shot up over the past month, it is more likely to experience a reversal, so maybe they will pass on that company. Others may have gone up over 3 months, indicating a momentum effect. This company is more appealing than others on the list.

All of these considerations show how research can be applied to deliver better funds to investors. Although new papers will rarely shake the foundations of the investment world, each discovery adds new considerations for how trading should be undertaken. We are confident in Dimensional, who continue to lead the industry in new research and efficient applications for clients.

Silicon Valley Bank

The rapid collapse of Silicon Valley Bank may well be the biggest story in the world right now. With a total asset base of $209 billion, the bank's failure is the largest since the global financial crisis. We wanted to talk about what's happening now and what it means for portfolios.

First of all, why did the bank collapse?

SVB was the most popular bank for start-ups and tech. The past few years saw a huge boom for tech companies and SVB's deposits grew. These funds had to go somewhere. The bank chose 10-year US Treasuries, which were yielding a measly 1.5% p.a.

The one-two punch hit SVB in the form of higher interest rates and the start-up/tech industry drying up. Last year brought sharp interest rate rises and bond prices fell. The longer the bond, the bigger the price cut. On the other hand, SVB's chosen clients tend to run at losses. They were withdrawing their deposits to cover their costs. Usually the cash to run these businesses came from venture capital (VC) firms.

The bank ended up having more money going out than coming in. It became necessary to sell bonds at a loss to cover the shortfall. They decided to try raise capital to keep some liquidity and calm their clients. Instead, their VC clients withdrew funds in a panic, precipitating a bank run which led to SVB's demise.

We should put the size of this collapse in better context. As we mentioned above, this is the largest collapse since the GFC.

A few things about this chart. You may notice the text below stating "does not include investment banks". This omits Lehman Brothers, an investment bank with the prize for largest bankruptcy in history. They had a $600 billion asset base. Also, this chart doesn't address inflation of about 40% in the time between the GFC and now.

SVB is a big bank, but they are dwarfed by the big four US banks, who manage a collective $9.11 trillion between them.

These other banks have much more diversified business models and customer bases. The risks they face are very different to SVB, with their focus on smaller start-ups.

Following the GFC, additional regulations were placed on large US banks, requiring stringent capital requirements and stipulations for diversification. SVB faced less regulatory oversight due to the smaller size of the bank.

Interestingly, these oversights were reduced in 2018, with the change strongly supported by SVB's cheif Executive, Greg Becker. One change was a reduction in the required cash on hand required by regional banks to weather storms like these.

We don't want to dismiss SVB as a drop in the bucket. It's failure will have flow on effects throughout the industry. We do want to contextualise the failure historically and against their peers.

In order to shore up confidence, we received a joint statement by US Treasury Secretary Janet Yellen, Chairman of the Federal Reserve Jerome Powell and Federal Deposit Insurance Corporation (FDIC) Chairman Martin J. Gruenberg yesterday. They announced the FDIC will guarantee all deposits including uninsured deposits. The bank will not be bailed out, so shareholders will not be covered.

The response should ease fears of further bank runs and ensure those companies banking with SVB will have liquidity needs met. These businesses already have access to their deposits. This rapid response shows the efficiency with which the FDIC fulfills their role.

But how does all of this affect our portfolios?

The direct impact is negligible. SVB is included in Dimensional's Global Core Equity Trust, which is an important part of our portfolios. Before the share price collapsed, it represented about 0.03% of the fund, or 3 cents for each $100. The Global Core fund includes shares of about 2,000 US companies. This shows the importance of wide diversification.

The indirect impact is difficult to predict. The shares of other banks will be affected, both due to the interconnected nature of the financial services industry and the risk estimated by investors. This impact is clear for regional banks, which are more comparable to SVB. The SPDR S&P Regional Bank ETF has fallen 20%. It is important to remember, this information has already been priced in.

The wider implications for the market are hard to foresee. Clearly this is not a positive development. But stock markets are incredibly complex and this is only one factor. We are also experiencing a period of rising interest rates, slowing inflation, strong employment and a myriad of other factors. Trying to make predictions around a single event is not beneficial for long-term investors, especially when this information is already priced in.

We may continue to see volatility in markets as investors wrestle with these factors. With diversification and a long-term strategy, even a surprise bank collapse needn't derail our plans.